Experian
Score dial Redesign
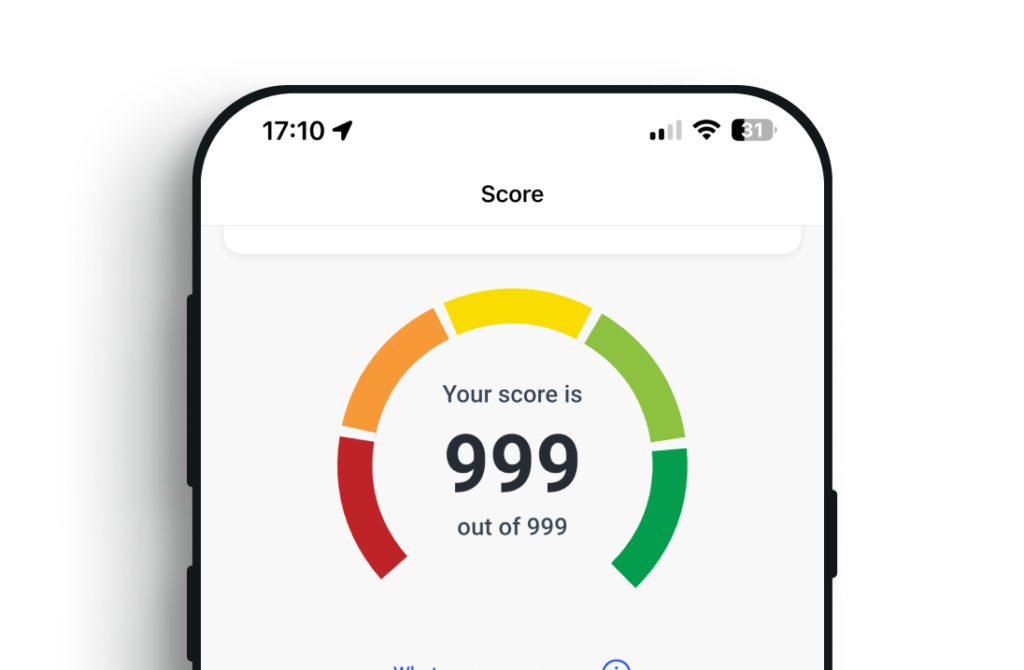
While working at Experian, I’ve been working on the redesign of one of the brand’s most recognisable elements, the credit score dial. Any design changes come with several important considerations: it must be easy for users to understand, remain instantly recognisable, be consistent with the broader brand language, and meet accessibility standards.
The first phase of this work focused on understanding how users engage with the current dial, and identifying what matters most to them when viewing their credit score.
I began by running usability tests to uncover what users found important within the current dial. I was especially interested in what elements they could recall after interacting with it, such as the score band name or the numerical value.
To explore this further, I created prototypes that selectively removed key elements (like the band labels or total score) and tested how users responded. This helped reveal which aspects were truly essential and shaped the early thinking around information hierarchy in the redesign.
I also wanted to gain deeper insight into users’ emotional journeys particularly because checking a credit score can be a stressful or even intimidating experience for some users. This helped ensure our design direction was not only functional but also emotionally considerate
With insights from the initial research, I moved into concept testing. A key insight from early testing was that users place high value on the banding system the coloured segments that visually indicate the strength of a score.
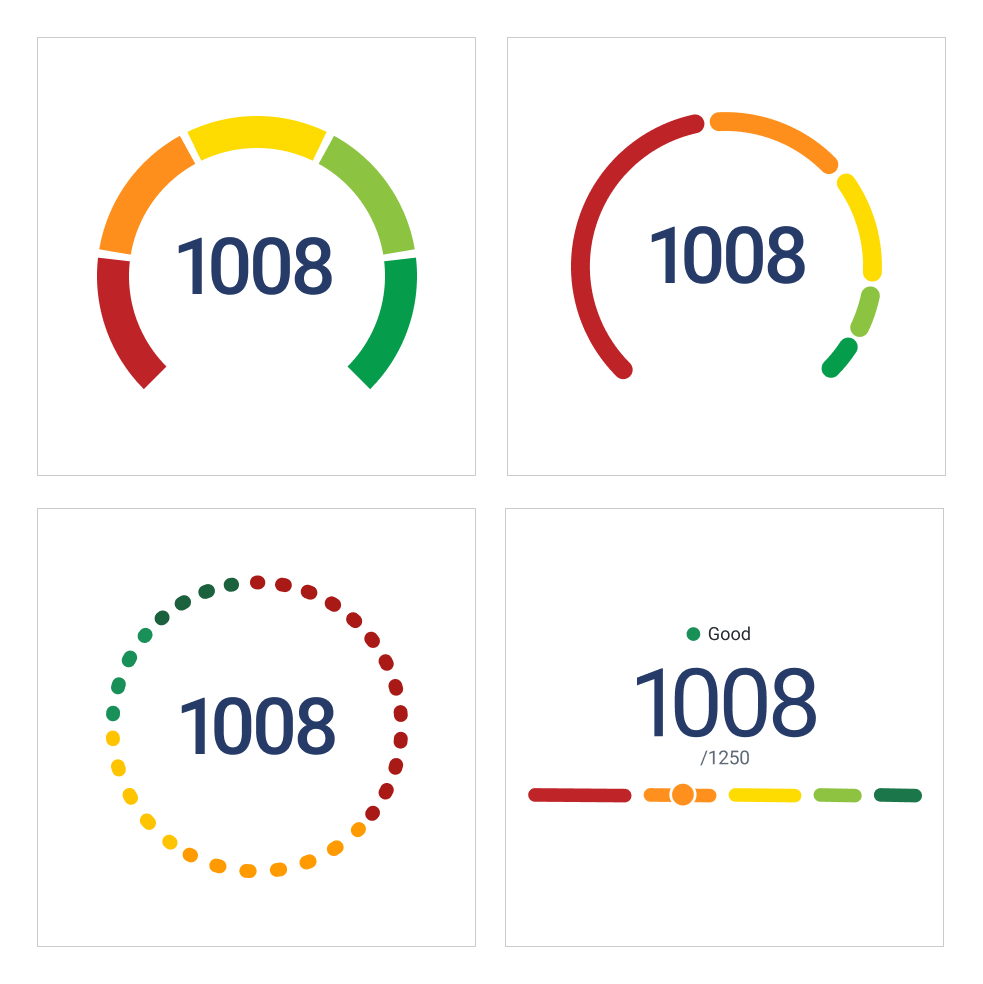
Currently, the dial uses a semi-circle format, with colours ranging from red and orange (for lower scores) through to green (for higher scores). I explored alternative visual formats, including:
A full circle representation
A horizontal “progress bar” format, mimicking timeline progression
A segmented dial where bands were visually weighted in proportion to how much of the score range each band covers
These explorations were designed to test which approaches offered the clearest, most meaningful user experience while retaining the visual clarity users expect from the dial.
In the emotional mapping research, I noticed a clear divide: users with higher scores tended to describe the experience as neutral or positive, while those in lower bands often found it stressful.
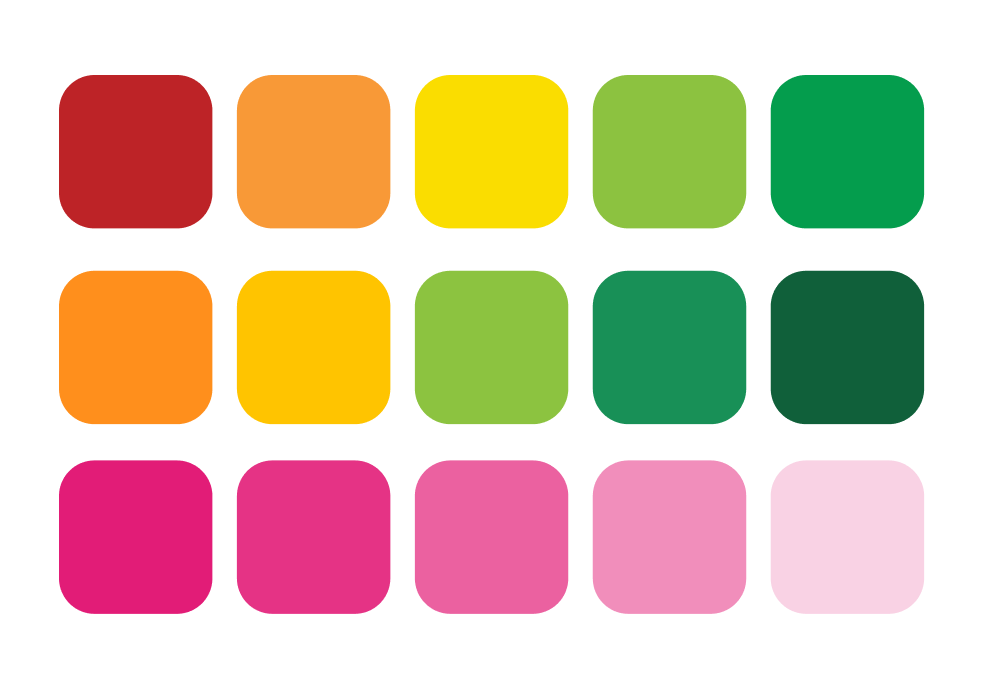
Colours played a big role in this emotional response. Red and orange, in particular, were frequently cited by lower-scoring users as negative triggers.
To address this, I explored several alternatives:
Removing red entirely, given its strong connotations
Softening the existing palette to reduce intensity
Testing brand colours as alternatives to the traffic light system
The aim was to maintain clear visual cues without adding to users’ anxiety — especially in moments where reassurance and clarity are most needed.

In the emotional mapping research, I noticed a clear divide: users with higher scores tended to describe the experience as neutral or positive, while those in lower bands often found it stressful.
Colours played a big role in this emotional response. Red and orange, in particular, were frequently cited by lower-scoring users as negative triggers.
To address this, I explored several alternatives:
-
Removing red entirely, given its strong connotations
-
Softening the existing palette to reduce intensity
-
Testing brand colours as alternatives to the traffic light system
The aim was to maintain clear visual cues without adding to users’ anxiety especially in moments where reassurance and clarity are most needed.